Banner Block
The HEATMAP page provides a convenient and visually intuitive way to analyze price changes and market capitalization of cryptocurrencies. Using a heatmap, users can instantly assess market conditions and identify key trends. Features:
Period Filter – Customize data display for different time frames..
Price Change Filter – Sort cryptocurrencies by growth or decline to quickly identify market leaders and underperformers.
Market Capitalization Filter – Analyze assets based on their market capitalization, focusing on top players or fast-growing projects with smaller caps.
-
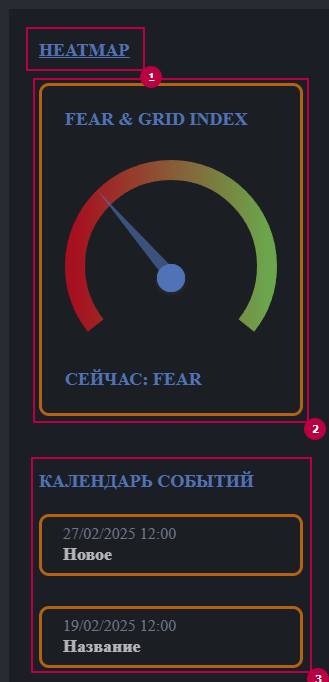
Grid and Fear Panel: Market Sentiment Indicator
This section provides a key metric reflecting the emotional state of market participants. The Grid and Fear (Greed and Fear) index analyzes market data and evaluates the level of optimism or panic among investors.
"Fear" – Signals potential buying opportunities as investors tend to sell assets due to negative sentiment.
"Greed" – Indicates market overheating, which could lead to a price correction.
The Event Calendar section displays all events created in the website’s administrative panel.